Comparisons with contingent liability differences
The comparison report with differences (passive contingency) is a feature that allows comparing request values between two audit cutoff dates. The goal is to identify the variation in values over time, considering only requests classified as passive contingency.
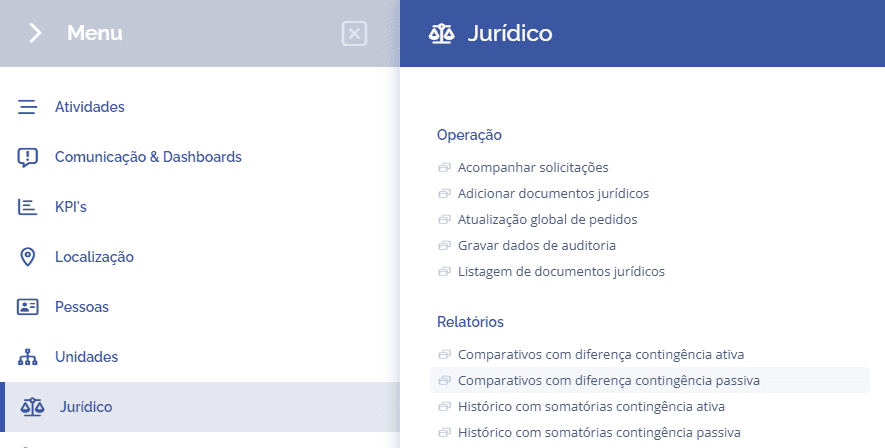
To access the comparison with differences (passive contingency), open the main menu, select the Legal, Reports, module, and click the Comparisons with difference passive contingency option.
Next, the block (Report: Comparisons with difference passive contingency) will be displayed:
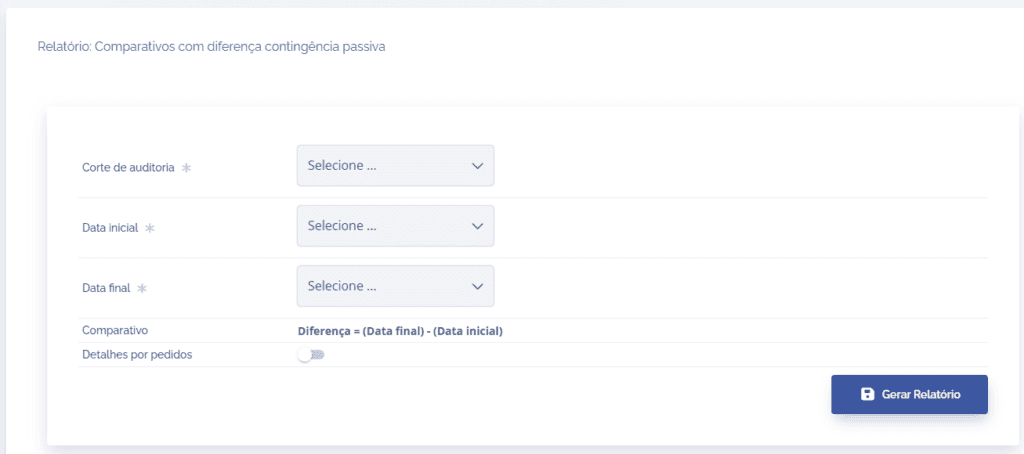
To generate the report, select an audit cutoff and a cutoff recording date, identified by the date + recording description, to use as the start date and an end date.
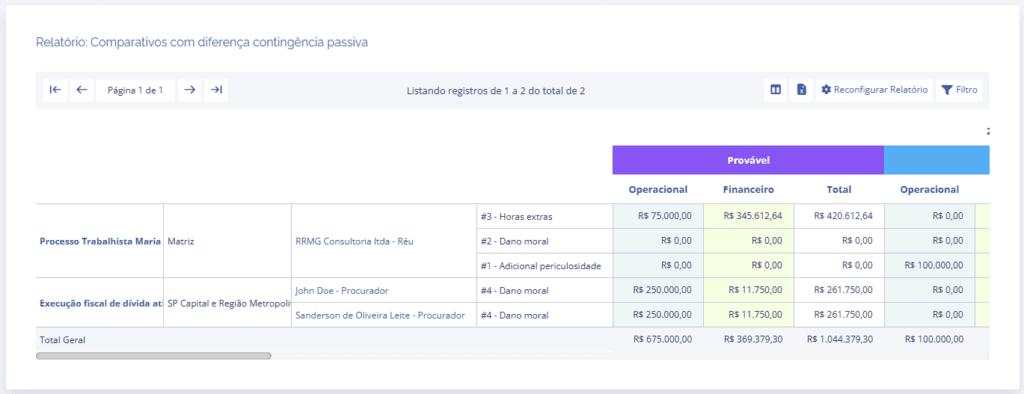
From there, the system automatically calculates the difference by subtracting the values from the start date from the values from the end date. It is also possible to detail the information by requests, making a more in-depth analysis easier.
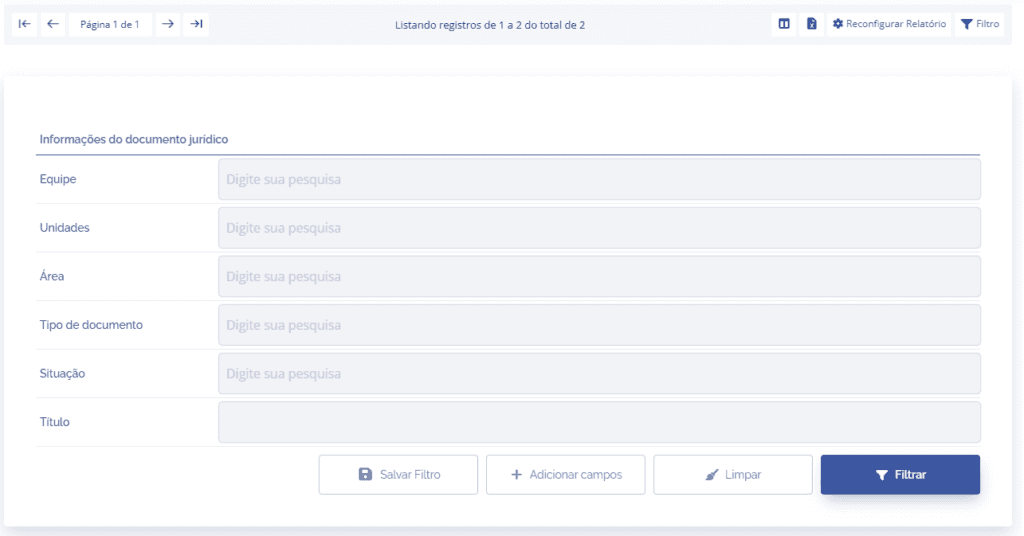
If you need to analyze specific data, the list lets you search the data by clicking the Filter button. You can filter by Team, Units, Area, Document type, Status, and Title, and you can also add other fields to the filter if needed by clicking the Add fields button.
If you need to run a new search, click the Reset Report button to access the home page.
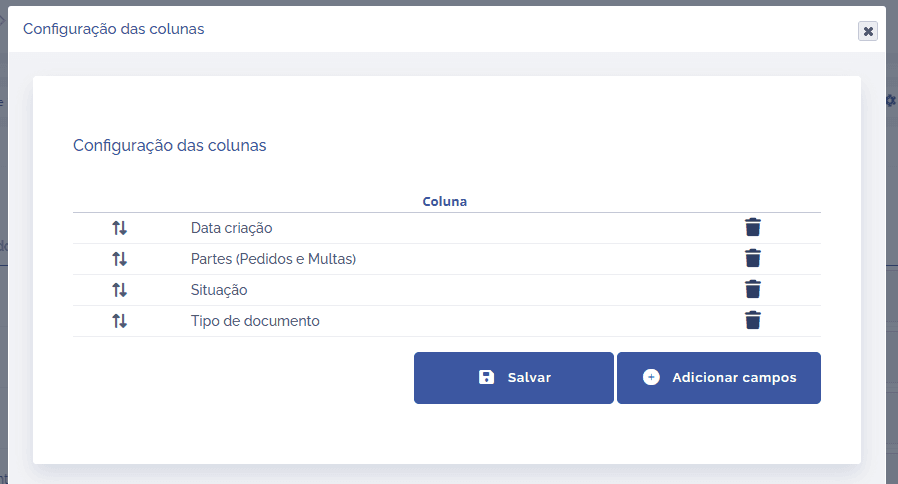
Next to the filter button, if you want to customize the display of the list columns, the system allows you to add, remove, or change the order and display of the columns by clicking the table icon shown below.
When you click the table icon, a floating window will be displayed, allowing you to reorder the columns and remove or add fields to be shown in the list.
In addition, it is possible to export the values/columns to an Excel (.xlsx) file by clicking the Excel document icon.
When you click the Excel document icon, a confirmation window will be displayed with a link to view the request.

By accessing the floating window link, the system will redirect to the Exported reports in Excel page, where you can view the request and download it after processing is complete.