
Activity metrics
When entering the overview of an activity, right below the cards, there is a block with the stage diagram and another with the activity Metrics.
When clicking on Metrics, the following screen will open:
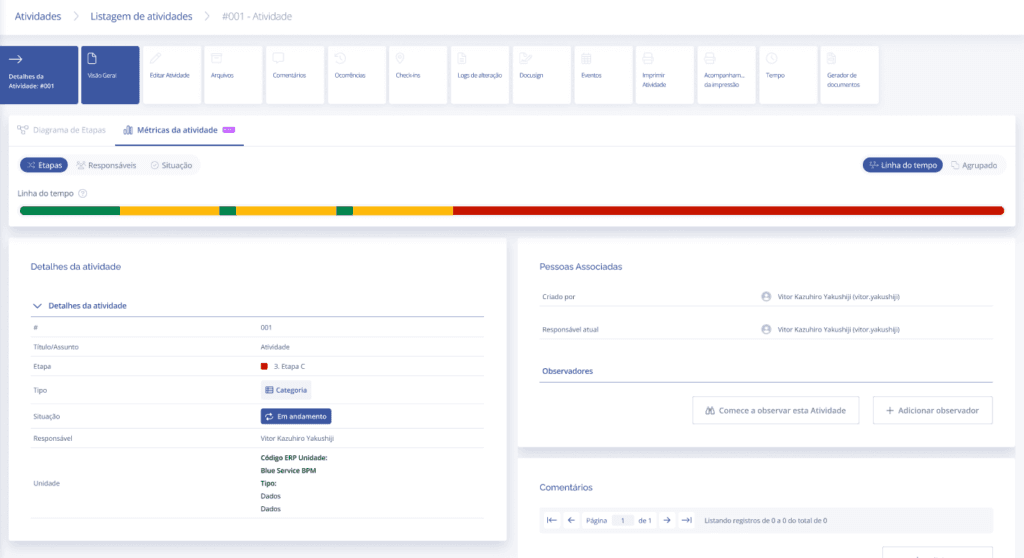
When entering the activity Metrics tab, there will be another element containing 3 tabs:
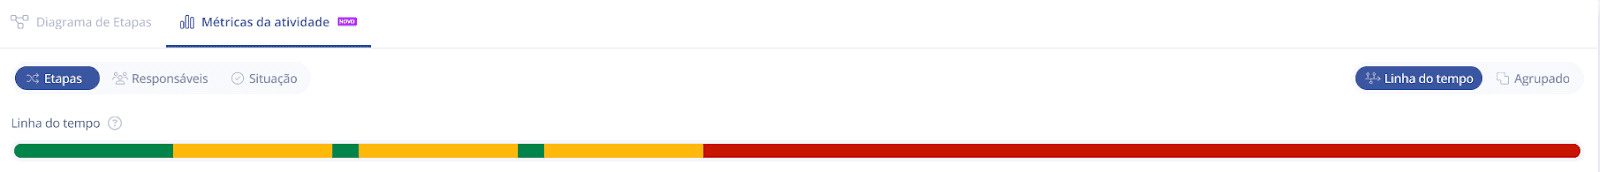
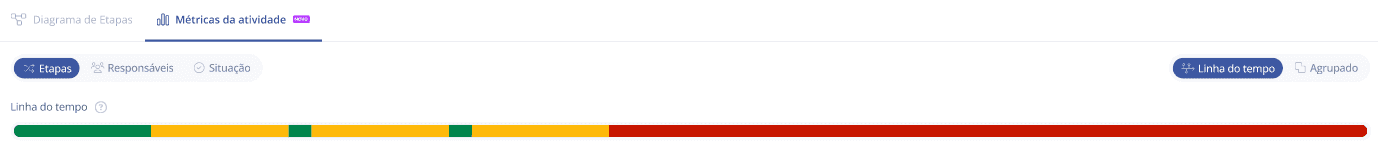
Stages
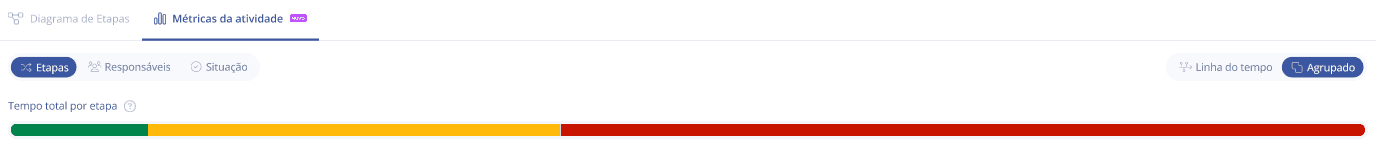
When choosing the Stages tab, a colored bar will be displayed showing the time spent in each stage. The colors shown will be the same ones selected in each stage.
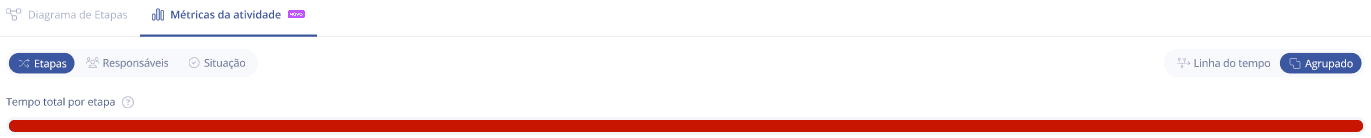
If the activity has gone through only one stage, the entire bar will be a single color:
The time spent in each stage can be displayed in two ways:
Timeline
In this option, the bar represents each stage according to the chronological order in which the activity passed through them.
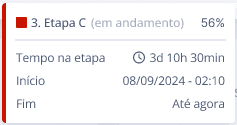
When hovering the mouse over each segment of the bar, a card will be displayed with the following information:
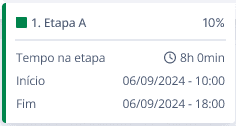
Stage name / percentage corresponding to the time that the stage took in the activity
Time in stage
Start
End
If the stage has not been completed, instead of the end date, the message appears: Until now
Grouped
In this option, the bar represents the stages by accounting for the total time spent in each of them:
When hovering the mouse over each bar, a card will be displayed with the following information:
Stage name / percentage corresponding to the time that the stage took in the activity
Total time
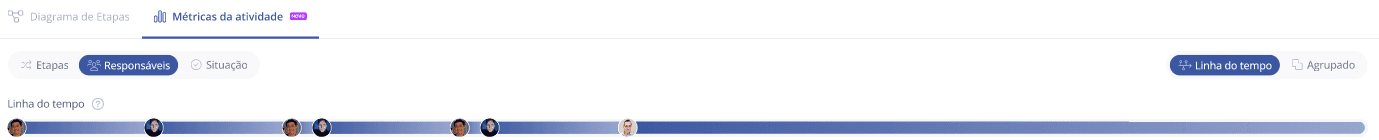
Assignees
When choosing the Assignees tab, a gradient bar will be displayed showing the time spent by each assignee, with the user's photo accompanying the beginning of the bar segment:
The time spent by each assignee can be displayed in two ways:
Timeline
In this option, the bar represents each assignee according to the chronological order in which the activity passed through them.
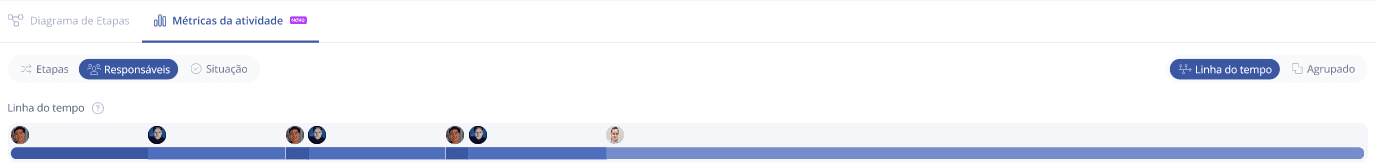
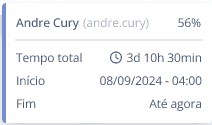
When hovering the mouse over each segment of the bar, a card will be displayed with the following information:
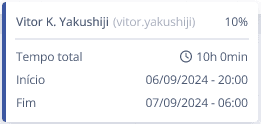
Assignee name and user / percentage corresponding to the time that the stage took in the activity
Total time
Start
End
If the activity has not been completed and remains with a certain assignee, instead of the end date, the message appears: Until now.
Grouped
In this option, the bar represents the total time spent per assignee.
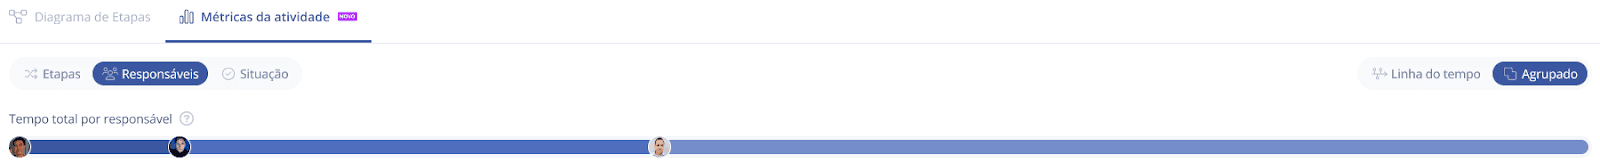
When hovering the mouse over each bar, a card will be displayed with the following information:
Assignee name and user / percentage corresponding to the time that the stage took in the activity
Total time
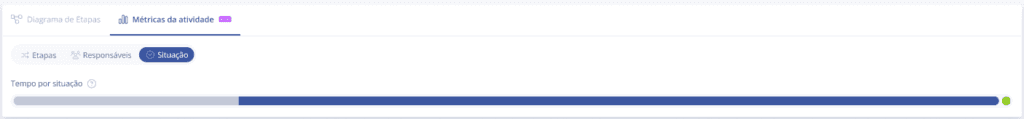
Status
When choosing the Status tab, a bar will be displayed showing the time spent in each activity status, with the not started status in gray and in progress in blue. In addition, there is an indication of whether the activity is already completed and/or canceled.
When hovering the mouse over the bar, a card will be displayed regarding the activity status at a given moment (which will be indicated by the start and completion date), with several possible statuses, namely: